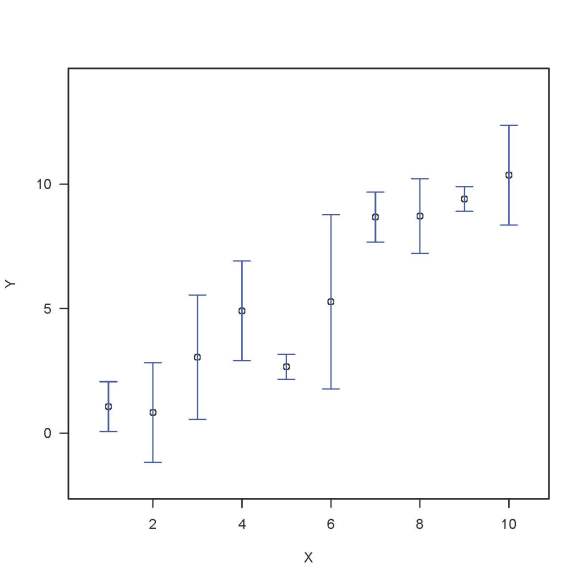
Perhaps you’ve found it tricky adding error bars to R plots. The R Book (Crawley, 2007) mentions that the function “arrows” can be used for error bars (p. 56). Below, I’ve provided an example which plots some points and draws some error bars.
For another version of a function for plotting error bars, see Error Bars with R: Part 2.
Reference
Crawley, Michael J., 2007. John Wiley & Sons, Ltd: The R Book. Chichester, West Sussex, England.
R Script
#Error Bar Example, written by Allan Roberts, Jan 20, 2013.
ErrorBarExample <- function(){
add.error.bars <- function(X,Y,SE,w,col=1){
X0 = X; Y0 = (Y-SE); X1 =X; Y1 = (Y+SE);
arrows(X0, Y0, X1, Y1, code=3,angle=90,length=w,col=col);
}
X <- 1:10;
Y <- X+rnorm(10,0,1);
SE <- c(1,2,2.5,2,0.5,3.5,1,1.5,0.5,2);
plot(X,Y,xlim=c(0.5,10.5), ylim=c(-2,14), las=1);
add.error.bars(X,Y,SE,0.1,col=4);
}
ErrorBarExample();


Pingback: Error Bars with R: Part 2 | The Madreporite