By Allan Roberts
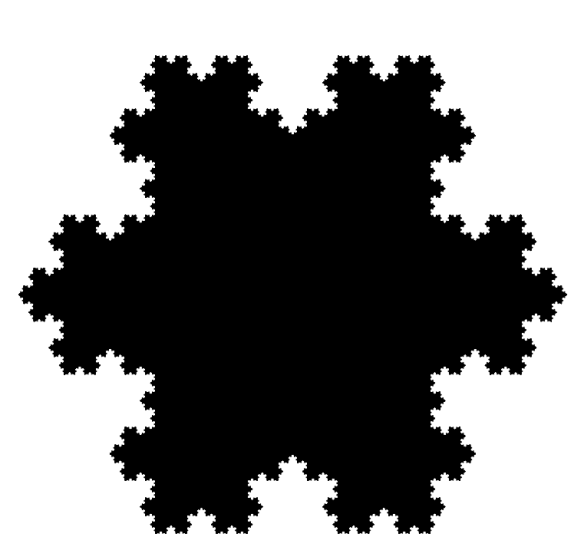
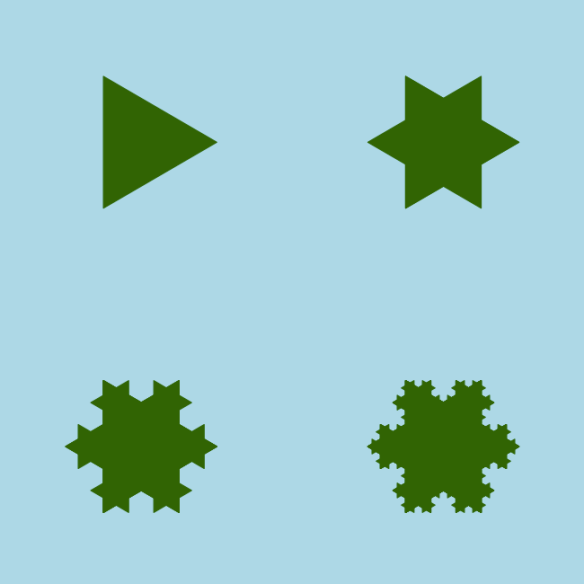
An interesting property of the Koch Snowflake is that it has a boundary, or edge, of infinite length. (For another curve of infinite length, confined within a finite area, see the post on the Hilbert Curve.) The shape is constructed out of equilateral triangles. A picture showing an approximation of the Koch Snowflake is given in Figure 1; this is only an approximation, since the shape would be defined as the limit of the process suggested in Figure 2. For more detail on the mathematics of the construction, you might like to start with the references given below (Wikipedia 2013; Wolfram MathWorld 2013).
From the ecological point of view, you might find this fractal thought-provoking when it comes to questions of scale. Suppose, for example, that you think a certain boundary, such as a shoreline, is ecologically important, and you want to measure it. Then the length will depend on the scale of measurement. (See, for example, Mandelbrot, 1967.)
Figures 1 and 2 were produced using the functions provided in the R Script below. I’ve focused on drawing the images, rather than constructing the set of points that describe the fractal edge of the shape. My algorithm is inefficient in the sense that it computes many more triangles than required; also, the large number of conditional statements suggests that the number of lines of code could be reduced. The key concept is contained within a function that takes the vertices of a triangle as input, and which returns the vertices of a smaller triangle as output; this function is then called recursively. To find the vertices of smaller triangles, the new vertices are computed as linear combinations of the old vertices.
References
Koch Snowflake. Wikipedia: http://en.wikipedia.org/wiki/Koch_snowflake
Koch Snowflake. Wolfram Mathworld: http://mathworld.wolfram.com/KochSnowflake.html
Mandlebrot, B. 1967. How long is the coast of Britain? Science, 156 (3775), pp. 636-638.
R Script
#Script by A. Roberts, 2013.
#To run the script, copy and paste it onto the R command line, and press ,<enter>.
KochSnowflakeExample <- function(){
iterate <- function(T,i){
A = T[ ,1]; B=T[ ,2]; C = T[,3];
if (i == 1){
d = (A + B)/2; h = (C-d); d = d-(1/3)*h;
e = (2/3)*B + (1/3)*A; f = (1/3)*B + (2/3)*A;
}
if (i == 2){
d = B; e = (2/3)*B + (1/3)*C; f = (2/3)*B + (1/3)*A;
}
if (i == 3){
d = (B + C)/2; h = (A-d); d = d-(1/3)*h;
e = (2/3)*C + (1/3)*B; f = (1/3)*C + (2/3)*B;
}
if (i == 4){
d = C; e = (2/3)*C + (1/3)*A; f = (2/3)*C + (1/3)*B;
}
if (i == 5){
d = (A + C)/2; h = (B-d); d = d-(1/3)*h;
e = (2/3)*A + (1/3)*C; f = (1/3)*A + (2/3)*C;
}
if (i == 6){
d = A; e = (2/3)*A + (1/3)*C; f = (2/3)*A + (1/3)*B;
}
if (i == 0){
d = A; e = B; f = C;
}
Tnew = cbind(d,e,f)
return(Tnew); #Return a smaller triangle.
}
draw <- function(T, col=rgb(0,0,0),border=rgb(0,0,0)){
polygon(T[1,],T[2,],col=col,border=border)
}
Iterate = function(T,v,col=rgb(0,0,0),border=rgb(0,0,0)){
for (i in v) T = iterate(T,i);
draw(T,col=col,border=border);
}
#The vertices of the initial triangle:
A = matrix(c(1,0),2,1);
B = matrix(c(cos(2*pi/3), sin(2*pi/3)),2,1);
C = matrix(c(cos(2*pi/3),-sin(2*pi/3)),2,1);
T0 = cbind(A,B,C);
plot(numeric(0),xlim=c(-1.1,1.1),ylim=c(-1.1,1.1),axes=FALSE,frame=FALSE,ann=FALSE);
par(mar=c(0,0,0,0),bg=rgb(1,1,1));
par(usr=c(-1.1,1.1,-1.1,1.1));
#Draw snowflake:
for (i in 0:6) for (j in 0:6) for (k in 0:6) for (l in 0:6) Iterate(T0,c(i,j,k,l));
}
KochSnowflakeExample(); #Run the example.


