Fractals with R, Part 5: Sierpinski Carpet with ggplot2

Figure 1. Sierpinski Carpet

Figure 1. Sierpinski Carpet.

By Allan Roberts

This post uses the graphics package ggplot2 (Wickham, 2009) to illustrate a new method of making an image of the Sierpiński Carpet, which was featured in a previous post (Fractals with R, Part 2: the Sierpiński Carpet). The method used to make the matrix representing the fractal is the same; again, the algorithm is essential the same as the described in described in Weisstein (2012), but implemented in R. In this post, I have used the graphics package ggplot2 to display the image. The ggplot2 layer “geom_tile” produces output much like the function “image” in the base graphics package. View ports made with the “grid” package are used to make the four panels of the plot shown in figure 1; one of the advantages of ggplot2 is that it makes it relatively easy to work with the grid package in this way. Because the function “ggplot” takes a data frame as an argument,  some extra work was required to turn the matrix representing an iteration of the fractal into a data frame with X and Y columns for the positions of cells, and an indicator column I to represent the colour of the cell. Running the script provided below requires that you have the “ggplot2” package installed; if you have an internet connection, this can be done by entering install.packages(“ggplot2”) on the R command line. (The grid library should come already installed with the basic installation of R.)

Reference

H. Wickham. ggplot2: elegant graphics for data analysis. Springer New York, 2009.

Weisstein, Eric W. “Sierpiński Carpet.” From MathWorld– A Wolfram Wed Resource Accessed Oct. 22, 2012: http://mathworld.wolfram.com/SierpinskiCarpet.html

R Script

#Written by Allan Roberts, Feb 2014
library(ggplot2)
library(grid)
SierpinskiCarpet <- function(k){
Iterate <- function(M){
A <- cbind(M,M,M);
B <- cbind(M,0*M,M);
return(rbind(A,B,A))
}
M <- as.matrix(1)
for (i in 1:k) M <- Iterate(M);
n <- dim(M)[1]
X <- numeric(n)
Y <- numeric(n)
I <- numeric(n)
for (i in 1:n) for (j in 1:n){
X[i + (j-1)*n] <- i;
Y[i + (j-1)*n] <- j;
I[i + (j-1)*n] <- M[i,j];
}
DATA <- data.frame(X,Y,I)
p <- ggplot(DATA,aes(x=X,y=Y,fill=I))
p <- p + geom_tile() + theme_bw() + scale_fill_gradient(high=rgb(0,0,0),low=rgb(1,1,1))
p <-p+ theme(legend.position=0) + theme(panel.grid = element_blank())
p <- p+ theme(axis.text = element_blank()) + theme(axis.ticks = element_blank())
p <- p+ theme(axis.title = element_blank()) + theme(panel.border = element_blank());
return(p)
}
A <- viewport(0.25,0.75,0.45,0.45)
B <- viewport(0.75,0.75,0.45,0.45)
C <- viewport(0.25,0.25,0.45,0.45)
D <- viewport(0.75,0.25,0.45,0.45)
quartz(height=6,width=6)
print(SierpinskiCarpet(1),vp=A)
print(SierpinskiCarpet(2),vp=B)
print(SierpinskiCarpet(3),vp=C)
print(SierpinskiCarpet(4),vp=D)

Fractals with R, Part 4: The Koch Snowflake

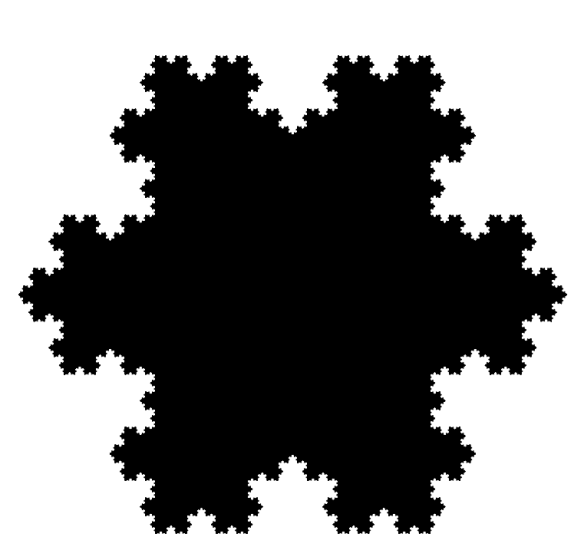
Figure 1. The Koch Snowflake

Figure 1. An approximation of the Koch Snowflake.

By Allan Roberts

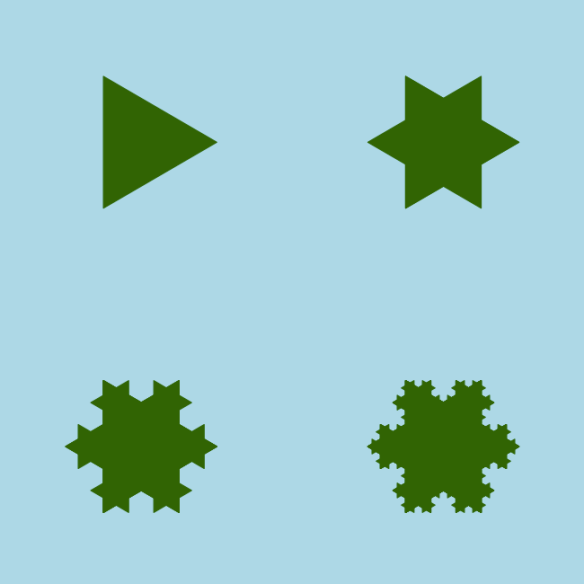
An interesting property of the Koch Snowflake is that it has a boundary, or edge, of infinite length. (For another curve of infinite length, confined within a finite area, see the post on the Hilbert Curve.) The shape is constructed out of equilateral triangles. A picture showing an approximation of the Koch Snowflake is given in Figure 1; this is only an approximation, since the shape would be defined as the limit of the process suggested in Figure 2. For more detail on the mathematics of the construction, you might like to start with the references given below (Wikipedia 2013; Wolfram MathWorld 2013).

Figure 2. Iterations of the snowflake.

Figure 2. Iterations of the snowflake (or island, depending on the colour scheme).

From the ecological point of view, you might find this fractal thought-provoking when it comes to questions of scale. Suppose, for example, that you think a certain boundary, such as a shoreline, is ecologically important, and you want to measure it. Then the length will depend on the scale of measurement. (See, for example, Mandelbrot, 1967.)

Figures 1 and 2 were produced using the functions provided in the R Script below. I’ve focused on drawing the images, rather than constructing the set of points that describe the fractal edge of the shape. My algorithm is inefficient in the sense that it computes many more triangles than required; also, the large number of conditional statements suggests that the number of lines of code could be reduced. The key concept is contained within a function that takes the vertices of a triangle as input, and which returns the vertices of a smaller triangle as output; this function is then called  recursively. To find the vertices of smaller triangles,  the new vertices are computed as linear combinations of the old vertices.

References

Koch Snowflake. Wikipedia: http://en.wikipedia.org/wiki/Koch_snowflake
Koch Snowflake. Wolfram Mathworld: http://mathworld.wolfram.com/KochSnowflake.html
Mandlebrot, B. 1967. How long is the coast of Britain? Science, 156 (3775), pp. 636-638.

R Script
#Script by A. Roberts, 2013.
#To run the script, copy and paste it onto the R command line, and press ,<enter>.

KochSnowflakeExample <- function(){
iterate <- function(T,i){
A = T[ ,1]; B=T[ ,2]; C = T[,3];
if (i == 1){
d = (A + B)/2; h = (C-d); d = d-(1/3)*h;
e = (2/3)*B + (1/3)*A; f = (1/3)*B + (2/3)*A;
}

if (i == 2){
d = B; e = (2/3)*B + (1/3)*C; f = (2/3)*B + (1/3)*A;
}

if (i == 3){
d = (B + C)/2; h = (A-d); d = d-(1/3)*h;
e = (2/3)*C + (1/3)*B; f = (1/3)*C + (2/3)*B;
}

if (i == 4){
d = C; e = (2/3)*C + (1/3)*A; f = (2/3)*C + (1/3)*B;
}

if (i == 5){
d = (A + C)/2; h = (B-d); d = d-(1/3)*h;
e = (2/3)*A + (1/3)*C; f = (1/3)*A + (2/3)*C;
}

if (i == 6){
d = A; e = (2/3)*A + (1/3)*C; f = (2/3)*A + (1/3)*B;
}

if (i == 0){
d = A; e = B; f = C;
}

Tnew = cbind(d,e,f)
return(Tnew); #Return a smaller triangle.
}

draw <- function(T, col=rgb(0,0,0),border=rgb(0,0,0)){
polygon(T[1,],T[2,],col=col,border=border)
}

Iterate = function(T,v,col=rgb(0,0,0),border=rgb(0,0,0)){
for (i in v) T = iterate(T,i);
draw(T,col=col,border=border);
}

#The vertices of the initial triangle:
A = matrix(c(1,0),2,1);
B = matrix(c(cos(2*pi/3), sin(2*pi/3)),2,1);
C = matrix(c(cos(2*pi/3),-sin(2*pi/3)),2,1);
T0 = cbind(A,B,C);

plot(numeric(0),xlim=c(-1.1,1.1),ylim=c(-1.1,1.1),axes=FALSE,frame=FALSE,ann=FALSE);
par(mar=c(0,0,0,0),bg=rgb(1,1,1));
par(usr=c(-1.1,1.1,-1.1,1.1));

#Draw snowflake:
for (i in 0:6) for (j in 0:6) for (k in 0:6) for (l in 0:6) Iterate(T0,c(i,j,k,l));
}
KochSnowflakeExample(); #Run the example.

Fractals with R, Part 3: The Hilbert Curve

Imagine a meandering river. Imagine, furthermore, that every meandering has a meandering within it. This is one way that you might visualize the Hilbert Curve, an example of a space-filling curve. The complexity of this “river” may have implications for ecological study design. How, for example, would you measure the distance between the source of the river (lower left) and the ocean (lower right)? For a mathematical description of the Hibert Curve, see Sagan (1994).

Figure 1. Iterations in the construction of the Hilbert Curve.

The graphics in Figure 1 can be produced by cutting and pasting the R script given below into your R console. For more, see Fractals with R, Part 1 and Part 2.

References

Sagan, Hans. 1994. “Space-filling curves”. Springer-Verlag.

R Script

#Written by Allan Roberts, 2012.
hilbert.curve <- function(n){

Double <- function(A){
#The matrix for “H(n)” is equal to “Double(H(n-1))”.

m <- dim(A)[1];
n <- dim(A)[2];
N <- m*n;
B <- A+N;
C <- B+N;
D <- C+N;
E <- cbind(rbind(B,skew.transpose(A)),rbind(C,t(D)));
return(E);
}

Rotate <- function(A){
#Rotates the matrix A clockwise.

m <- dim(A)[1];
n <- dim(A)[2];
N <- m*n;
B <- matrix(0,m,n);
for (i in 1:m) for (j in 1:n) B[j,n+1-i] <- A[i,j]
return(B);
}

skew.transpose <- function(A){
return(Rotate(Rotate(t(A))));
}

rowofx <- function(A,x){

#Returns the row index of the matrix A for entry equal to x.
m <- dim(A)[1];
n <- dim(A)[2];
for (i in 1:m) for (j in 1:n) if (A[i,j]==x) return(i);
}

colofx <- function(A,x){

#Returns the column index of the matrix A for entry equal to x.
m <- dim(A)[1];
n <- dim(A)[2];
for (i in 1:m) for (j in 1:n) if (A[i,j]==x) return(j);
}

Draw <- function(A){
#Draws a graphical representation of the matrix A.
A <- Rotate(A);
m <- dim(A)[1];
n <- dim(A)[2];
N <- m*n;
plot(  (rowofx(A,1)-1)/n, (colofx(A,1)-1)/n, pch=19,cex=0.5,ylim = c(0,1), xlim =c(0,1),     ylab=character(1),xlab=character(1),axes=FALSE);
d <- 1/n;
for (i in 1:(N-1)) lines(c((rowofx(A,i)-1)/n,((rowofx(A,i+1)-1)/n)), c((colofx(A,i)-1)/n,((colofx(A,i+1)-1)/n)),lwd=1);
points((rowofx(A,N)-1)/n, (colofx(A,N)-1)/n, pch=19,cex=0.5);
}

H <- function(n){
#H(1) is shown in Figure 2.
if (n==0) return(matrix(c(2,1,3,4),2,2));
return(Double(H(n-1)));
}

Draw(H(n));
}
hilbert.curve(n=3);


Fractals with R, Part 2: the Sierpiński Carpet

by Allan Roberts

This post is a variation on the previous post, Fractals with R. Here it is shown how a different fractal pattern can be produced by just a slight variation in the R script; the result is an iteration of a fractal called the Sierpiński Carpet. The method used here is basically the same as that described in Weisstein (2012). Below is the R script that produces the image.

Figure 1. An iteration in the construction of the Sierpiński Carpet, which I produced using R.

This fractal is an example of a pattern with both large and small patches. There are also distributions in ecology which are patchy across scales; see, for example Levin (1992). You might find the Sierpiński Carpet somewhat reminiscent of a fragmented eelgrass bed, or a distribution of mussels and barnacles in the intertidal.

From the point of view of handling data structures, this Sierpiński Carpet plot is an exercise in using the “rbind” and “cbind” functions in R, which allow you to aggregate matrices and data frames. I’ve found these functions useful for working with oceanographic data, such as that plotted in my posts on how to plot NEPTUNE Canada data and VENUS network data. For more, see Fractals with R, Part 3.

R Script

IterateCarpet <- function(A){
B <- cbind(A,A,A);
C <- cbind(A,0*A,A);
D <- rbind(B,C,B);
return(D);
}

S <- matrix(1,1,1);
for (i in 1:5) S <- IterateCarpet(S);

image(S,col=c(0, 12), axes=FALSE);

References

Levin, Simon A., 1992. The Problem of Pattern and Scale in Ecology:  The Robert H. MacArthur Award Lecture. Ecology, 73 (6), 1992, pp. 1943-1967.

 R Development Core Team, 2011. R: A language and environment for statistical computing. R Foundation for Statistical Computing, Vienna, Austria.

Weisstein, Eric W. “Sierpiński Carpet.” From MathWorld– A Wolfram Wed Resource Accessed Oct. 22, 2012: http://mathworld.wolfram.com/SierpinskiCarpet.html

Fractals with R

by Allan Roberts

Many biological objects have structure that, at least at a glance, may appear rather fractal-like. A brief discussion of the applicability of fractals and fractal dimension to biology can be found in Vogel’s ‘Comparative Biomechanics‘ (2003, pp. 84–86). While noting that there seem to be few truly fractal objects in biology, Vogel speculates, “I think, […], that sponges may be fractal, with large ones organized mainly as foldings and refoldings of proliferated small ones, thereby making transitions between the organizational grades we learned as ascons, sycons, and leucons” (p. 86).

Sierpinski triangles

Figure 1. Four iterations in the construction of a Sierpinski triangle-like object. I produced these graphics using the statistical programming language R (R Development Core Team, 2011).

I’ve included an image, representing the construction of a fractal largely similar to a famous fractal, the Sierpiński triangle. A mathematical description of the Sierpiński triangle can be found in Vejnar (2012). (In contrast to the actual Sierpiński triangle, my example is based on right-angled triangles, rather than on equilateral ones.) These images were produced using the statistics application and programming language R (R Development Core Team, 2011). I’ve also included the R script that I used to produce the graphics. For more, see Fractals with R, Part 2.

R Script
IterateTriangle <- function(A){
    B <- cbind(A,0*A);
    C <- cbind(A,A);
    D <- rbind(B,C);
return(D);
}

par(mfrow=c(2,2))
for (i in 1:4){
    T <- matrix(1,1,1)
    for (i in 1:i) T <- IterateTriangle(T);
    image(T,col=c("white","black"),axes=FALSE);
    text(0,1,i,col="black") 
}

References

R Development Core Team, 2011. R: A language and environment for statistical computing. R Foundation for Statistical Computing, Vienna, Austria.

Vejnar, Benjamin. 2012. A topological characterization of the Sierpiński triangle.       Topology and its Applications, 159 (5), 1404-1408.

Vogel, Steven. 2003. Comparative Biomechanics: Life’s Physical World. Princeton University Press: Princeton, New Jersey.