Free R Workshop at BMSC

by Amanda Kahn

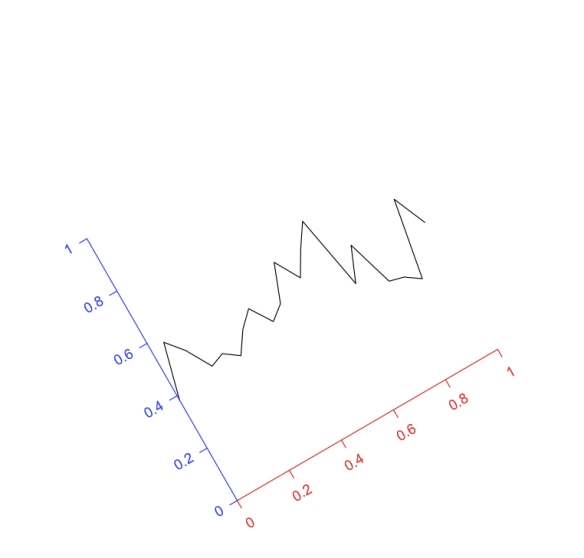
Figure 1. A line graph at a  30 degree angle.

Figure 1. The workshop will likely focus on making data plots, and other R basics.

Guest speaker Allan Roberts from Ocean Networks Canada will be presenting a workshop on R, a versatile statistics package that’s useful in the marine sciences and related disciplines. For a summary of recent data workshops which were held at UVic in July, click here.

R Workshop
The day: August 1, 2013
The hour: 7:00 PM
The location: Rix Classroom C
What to bring: a computer with R installed (preferably R Studio)
Free for everyone.

Citizen scientist spots a hungry elephant seal in Barkley Canyon

by Amanda Kahn

NEPTUNE Canada is an underwater ocean observatory that’s been featured in some of our earlier posts:

Plotting oceanographic data collected by NEPTUNE
Freezing seawater from Cambridge Bay
Listening to whale songs
BC lighthouse temperature and surface salinity data
Data from the seafloor

This amazing resource provides real-time data being collected from several different nodes on the seafloor off the west coast of Vancouver Island and the Strait of Juan de Fuca.  Fourteen-year-old Kirill Dudko watches the live streams of video cameras placed at the sea floor at NEPTUNE Canada’s nodes.  He snaps up portions of the videos, broadcast for the first 15 minutes of the hour, on his Youtube channel (which I believe is this one, but I cannot be certain).  In one of the videos he captured, a female elephant seal slurped up a hagfish in view of the camera, providing the deepest video record of an elephant seal feeding.

All of this he did from his home in Ukraine.  It doesn’t matter where you are, or how far you are from the ocean, there are ways to get involved and get a look at the deep sea!  What wonders will you find?  Check out all of NEPTUNE Canada’s live streams and watch what’s going on on the seafloor!  You can even see the WallyCam, mounted on a rover that explores the seafloor, not unlike the Curiosity rover that is exploring Mars.  Maybe you’ll spot a squid, or a whale, or a sponge (hint: check out the Folger Pinnacle cam).

The Octopus of Saanich

By Jackson Chu and Danielle Ludeman

As part of the Oceans Network Canada observatory, the Victoria Experimental Network Under the Sea (VENUS) provides real-time measurements, images, and sound to researchers and observers on-shore.

Anyone, from scientists to the general public, can access the network’s data and monitor environmental changes as they happen (see here for a previous post on accessing and graphing VENUS using R). The VENUS instrumentation is found in the coastal waters of the Salish Sea and is the sister network to the offshore NEPTUNE Canada regional cabled ocean network

Video and data provided by Jackson Chu

Captured in this time-lapse video from Saanich Inlet is a juvenile, ~10 cm long, Pacific Red Octopus (Octopus rubescens), which had temporarily moved underneath the VENUS Camera Array for a month. When the oxygen levels drop to near zero, it decides to pack up and move somewhere more hospitable. You would to if you had a dozen squatters (Munida quadrispina) hanging around your neighborhood all day!
Note: You can see the white ball sponges (Suberites sp.) contracting in the video – the first time this behavior has been captured in situ on the bottom of the ocean. You can check out another time lapse of a contracting sponge done in the lab, Tethya wilhelma, and one of a freshwater sponge Ephydatia muelleri.

Metadata:
Location: Saanich Inlet, 96 m depth
Camera: Olympus C8080WZ
Exposure Settings: 7mm @ F5.6, 1/30s, ISO100, with offcamera strobe in custom housing
Time start: Sept. 14, 2012 @ 07:47:42 UTC
Time end: Oct. 09, 2012 @ 14:47:28 UTC
Total # of images: 1691 8MP still images (3264p x 2448p) taken in doublets (10 s interval) every 30 mins
Workflow:
Images were batched processed to 1440p x 1080p dimensions (Adobe Photoshop) and made into a 15 frames per second (fps) time lapse movie (Avidemux). The time lapse video was then stabilized and re-rendered (Adobe After Effects) because the images did not perfectly overlay on top of one another which resulted in shakey raw footage. Oxygen data profile for the time sequence was downloaded from the VENUS website, processed (Matlab), and plotted (Adobe Illustrator, Adobe Photoshop). The Oxygen profile was then overlaid onto the time lapse video (Adobe After Effects), and an animated time marker was added using keyframes before finalizing the video by pillarboxing into a 1080p HD-video with audio accompaniment (Adobe Premiere Pro).

Freezing Seawater: Data from Cambridge Bay

by Allan Roberts

You can access sea ice data from the NEPTUNE Canada observatory at Cambridge Bay, in the Arctic. How? For live Arctic ice data go to www.neptunecanada.com. Click on “DATA & TOOLS” and log in. Then click on “Data Search,” click on “Tools” and choose “Arctic Observatory.”

Figure 1. Hourly averages for ice thickness and water salinity. Location: Cambridge Bay, Cambridge Bay Dock station (69.114 N, 105.060 W, water depth 6 m). Data source: NEPTUNE Canada (accessed Nov 2012 at http://www.neptunecanada.com). Graph plotted with R.

The Data
Hourly averages for Oct 25, UTC.
Source: NEPTUNE Canada, http://www.neptunecanada.com.

year month day hour ice salinity

2012 10 25 0 0.11742062 27.1217342

2012 10 25 1 0.117969156 27.116128169

2012 10 25 2 0.119953206 27.115838405

2012 10 25 3 0.120090068 27.134417438

2012 10 25 4 0.12307668 27.132648218

2012 10 25 5 0.121284465 27.135914622

2012 10 25 6 0.124251313 27.137131234

2012 10 25 7 0.123291335 27.11412135

2012 10 25 8 0.123626263 27.112518787

2012 10 25 9 0.124672597 27.108994459

2012 10 25 10 0.12619236 27.104893645

2012 10 25 11 0.128541307 27.138603664

2012 10 25 12 0.129542576 27.095719877

2012 10 25 13 0.130593295 27.153260476

2012 10 25 14 0.132342038 27.142623608

2012 10 25 15 0.131895781 27.164480543

2012 10 25 16 0.131755875 27.156398032

2012 10 25 17 0.134317464 27.158526643

2012 10 25 18 0.133336918 27.153010388

2012 10 25 19 0.134056296 27.155455795

2012 10 25 20 0.134588446 27.165800435

2012 10 25 21 0.134001942 27.160435323

2012 10 25 22 0.135544097 27.15158589

2012 10 25 23 0.137094968 27.151961331

Listening to Whale Songs!

by Kara Aschenbrenner

Hydrophone data of orcas, humpback whales and Pacific white-sided dolphin vocalizations can be accessed from www.neptunecanada.com/news/sound-gallery/ or venus.uvic.ca/multimedia-features/hydrophone-highlights/whale-sounds/ .

Orcas. Photo Credit: Francine Mercier, Parks Canada (accessed from: http://www.dfo-mpo.gc.ca/oceans/publications/fedmpa-zpmfed/page01-eng.asp ). The Strait of Georgia is one of the busiest waterways for shipping vessels in Canada and the impacts on killer whales from the underwater noise pollution are of major concern.

Hydrophones (underwater microphones) installed in Folger Passage and the Strait of Georgia, part of the NEPTUNE Canada and VENUS networks, record vocalizations produced by cetaceans. These hydrophone recordings include the songs of transient and resident killer whale pods, humpback whales, fin whales and Pacific white-sided dolphins. The recordings provide scientists with important information about behavior, seasonal migrations, and population shifts (NEPTUNE Canada, 2012).

Pacific white-sided dolphin spotted from the R/V Thompson off of the west coast of Vancouver Island during a cruise for NEPTUNE Canada. Photo credit: NEPTUNE Canada. (Accessed Nov 13, 2012, at neptunecanada.ca/news/news-details.dot?id=35733)

Cetaceans are highly dependent on acoustics as a means of social communication and finding food (echolocation). This is because light can only travel short distances, ~5–20 meters in the water, whereas sound can travel an astonishing 1000 km (VENUS, 2012)! Therefore, the increase in background noise produced by overpassing shipping vessels is a major concern.  Possible impacts to whales from underwater noise exposure include  disturbance and masking of important sounds and hearing damage (Cato et al, 2004).

Spectrogram produced from the VENUS hydrophone array located at the Strait of Georgia East site (170 m depth). Whale sounds are heard during this hydrophone recording. Credit: VENUS Network. (Accessed Nov 13, 2012, at venus.uvic.ca/multimedia-features/hydrophone-highlights/whale-sounds/)

Different cetaceans produce a wide range of unique songs which can be heard with hydrophone recordings. Sounds can be described as whistles, clicks, groans, moans, squeaks and even barks (Seaworld, 2012). For example, dolphins generally sound chatty and produce clicking noises, whereas fin whales have low frequency calls (NEPTUNE Canada, 2012). Songs can also vary between different whale populations depending on which ocean basin they live in (Cato et al, 2000).

References

NEPTUNE Canada (2012). NEPTUNE Canada: An Invitation to Science. Victoria, B.C: University of Victoria.

NEPTUNE Canada, 2012. Website. Accessed Nov.12, 2012: www.neptunecanada.ca/

VENUS, 2012. Website. Accessed Nov. 12, 2012: www.venus.uvic.ca/

Cato, D.H., McCauley, R.D. and Noad, M.J. 2004. Potential effects of noise from human activities on marine animals. Proceedings of Acoustics 2004, Australian Acoustical Society Conference, Gold Coast, 3-5 November. Pp 369-74

Noad, M.J., Cato, D. H., Bryden, M.M. , Jenner, M-N. and Jenner, K.C.S. 2000. Cultural revolution in whale songs. Nature 408 (6812): 537.

Killer Whales. www.seaworld.org/animal-info/info-books/killer-whale/communication.htm. (Accessed Nov 14, 2012).

Oceanographic Data with R: Plot VENUS Network Data

By Allan Roberts

This tutorial provides instructions on downloading raw data from the Victoria Experimental Network Under the Sea (VENUS 2012) and plotting that data with the statistical application R (R Core Team 2012). For this tutorial, I will assume that you have at least some experience with R; however, if you have R installed, and can enter an instruction or two on the command line, that should be enough. If you want to plot data from the NEPTUNE Canada network, refer to my previous post, “How to plot NEPTUNE Canada data with R.” In general, downloading VENUS data is similar to downloading NEPTUNE data, but I did find that there are some differences.

Step 1. Download a data file 

1.1 Go to the VENUS network website:                                     www.venus.uvic.ca

Venus logo

1.2 If you already have an account click on “LOGIN.” (Note: If you have a NEPTUNE Canada account you can use the same e-mail and password to log into the VENUS site.) If you don’t have an account, click on “Register”:

Login

1.3 Click on “DATA” and choose “DOWNLOAD DATA”:

Download VENUS data

1.4 Under “Search Type” choose “Stationary Platform”:

Stationary platform

1.5 Under “Stationary Platform Data” choose “Search by Instrument”:

Search by instrument

1.6 There are gaps in the data record; for this example, I’ve chosen the last two weeks of August, 2012, as an example of a particular interval with available data. Under “Time Range” set the starting and ending date and time, and then click on “Search Active Locations”:

Search active locations

1.7 Under “Location” choose “Saanich Inlet”, “Central Node”, and “VIP-17.” I found these to be the default settings.

Location

1.8 Under “Instrument” choose “Aanderaa Optode 4175 (S/N 1684).” (Again, I found this to be the default setting.)

Anderaa optode

1.9 Under “Sensor(s)” choose “Temperature”:

Select temperature

1.10 Under “Processing” choose “No Averaging”:

No averaging

1.11 Under “Data Format” choose “Comma Separated Value Text File”:

csv file format

1.12 Leave “Metadata” (i.e. documentation) at the default setting of “FGDC HTML”, and click on “Search now”:

Search now

1.13 Wait ….

Requesting data

1.14 Click on the text file….

Data file

… you should get something like this:

Data file output

1.15 Here is one place where I found that downloading VENUS data differed a bit from downloading NEPTUNE data. For the VENUS data, I’ve found that the following works: Copy and paste the downloaded data into a Word file, and then save that file as a plain text file. The plain text file is readable from R. To copy the VENUS data, click on “Select All” …

Select all

… then click on “Copy”:

Copy from Safari

1.16 Paste the file into a Word document. Click on “Save As”; make the document name “VENUS data example”; make the location your desktop, and make the format “Plain Text”:

Save as plain text

When you save as a text file you may get the following warning. (The idea of saving as a text file is that we are not interested in fancy formatting, pictures, etc., we are only interested in the data.) Click “OK”.

File conversion

The result should be a “.txt” file called “VENUS data example” on your desktop:

File icon on desktop

1.17 Create a new folder, called “VENUS network data”, and drop the text file “VENUS data example” into this folder.

VENUS network data

Now that you have the VENUS data saved as a “.txt” file in your “VENUS network data” folder, you are ready to move onto the next step: reading the data file into R.

Step 2. Read the data file into R 

The steps for changing the working directory are the same as in the NEPTUNE data tutorial:

2.1 In the R console type “getwd( )”. This will tell you what your current working directory is:

getwd

2.2 If you are on a Mac click on “Misc”, and choose “Change Working Directory”:

set working directory mac

If you are on a PC, click on “File”, and choose “Change dir …”:

set working directory pc

2.3 If you are on a Mac, browse for the “VENUS network data” folder, click on it, and click on “Open”; if you are on a PC browse for the “NEPTUNE data” folder, click on it, and click on “OK.”

2.4 In the R console, type “getwd( )”; the “VENUS network data” folder should now be your working directory:

wd again with correct wd

2.5 Open the text file, and look at it. We want to skip all the documentation lines before the first line of data. For this example, there should be 15 lines. This includes the line with the variable names. (The variable names are not yet formatted for R; variable names in R need to be without spaces.)

read file skip 15 lines header false

2.6 Check the downloaded data by entering “head(data)”; this will show the first few lines of the data frame. (To see all the data, just type ”data”, and press enter.)

show data

2.7 To give names to the columns, type:

give names to columns

Enter “head(data)” again, and you should see names at the tops of the columns. (For this tutorial, we are not concerning ourselves with the flag variable in the third column.)
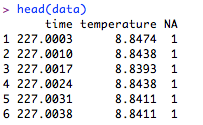
data with labels

Now that the data have been downloaded, you are ready to move onto plotting …


Step 3. Plot the data 

3.1 For a rough plot of the data, type:

rough plot code

rough plot

3.2 To plot the data as a line graph with a title, and with better axis labels, we can use two steps. First: The following command will plot the data without axis labels, and make the graph a line graph in blue.

line graph code

Second: Leave the graphics window open, and enter a command to add the title and axis labels.

Add title line

You should get a graph like the one below. I’ve found that the easiest way to put a graph made in R into a written document or slide show is to click on the graphics window and then use copy and paste.

final graph

3.3 Now go explore the other data available from the VENUS network!

Citations

VENUS, 2012. Website. Last accessed Oct. 17, 2012: www.venus.uvic.ca

R Core Team (2012). R: A language and environment for statistical computing. R Foundation for Statistical Computing, Vienna, Austria.

Viewing Hydrothermal Vents with NEPTUNE Canada’s SeaTube Pro

by Kara Aschenbrenner

Deep sea hydrothermal vents can be more than 2000 meters below the ocean surface! However, with NEPTUNE Canada’s SeaTube Pro you can view great video clips of the Grotto and Mothra hydrothermal vent fields that are positioned along the Endeavour Mid-ocean Ridge, located next door in the Pacific Ocean.  These vents produce superheated black plumes (~350 °C) of seawater rich in dissolved minerals such as sulfur, iron, zinc and copper. Once the hot effluent comes in contact with the cold sea water minerals precipitate and form tall chimneys (NEPTUNE Canada, 2012).

Black smoker

Black smoker observed at the Grotto hydrothermal Vent in the Endeavour Ridge rift valley. Photo credit – Flickr: Neptune Canada (Accessed October 12, 2012).

Hydrothermal vents are also great environments to view fascinating deep sea biology. Lush communities of tubeworms, limpets and scale worms are some of the amazing organisms that you can view with NEPTUNE Canada’s SeaTube.  What is really quite fascinating about these organisms is that they acquire nutrients from symbiotic chemosynthetic bacteria which thrive on inorganic molecules provided by the plume. In return, host organisms are preyed upon by vent predators including crabs. Vents are biological hotspots with local biomass exceeding the normal biomass observed for other deep sea regions by a factor of 500 – 1,000 (Tunnicliffe, 1992)!

Hydrothermal vent community

A dense cluster of tubeworms (Ridgeia piscesae), scale worms (Branchinotogluma tunnicliffae) and limpets forms a hot vent community at the Grotto hydrothermal vents (Depth: 2189 m). Photo Credit – Flickr: Neptune Canada (Accessed October 12, 2012).

Spider crabs

Tubeworms and spider crabs at the Endeavour segment of the Juan de Fuca Ridge. Photo Credit – NEPTUNE Canada SeaTube Pro (Accessed October 12, 2012).

In my opinion, the most extraordinary of the vent organisms are the Ridgeia piscesae (tubeworms).  These tubeworms have bright red gill plumes filled with hemoglobin rich blood to absorb oxygen and hydrogen sulfide from the ambient seawater.  The harvested oxygen and hydrogen sulfide gases are transferred to chemosynthetic bacteria located in the tubeworms trophosome – a specialized body part within the coelomic cavity. The bacteria oxidize the hydrogen sulfide gas, releasing chemical energy used to synthesize organic matter (NEPTUNE Canada, 2012).  Together the bacteria and tubeworms have a symbiotic relationship – the tubeworms provide the bacteria with a home, and in return the bacteria provide the tubeworms with food.

Black smoker with Ridgeia

Black smoker chimney covered with tubeworms (Ridgeia piscesae) photographed at Endeavour segment of the Juan de Fuca Ridge. (Depth: 2130 m). Photo Credit: Flickr: Neptune Canada (Accessed October 12, 2012).

How to access archived video data available on NEPTUNE Canada’s website:

  1. To view vent features on the ocean floor, real time video data can be accessed from http://www.neptunecanada.com/.
  2. Before accessing the video data you will need to set up your own user account.   To do so, first click on the “Data & Tools” tab located on the top bar.  Once you have opened the “Data & Tools” tab, click on the “open an account” link highlighted in orange located underneath the heading “Oceans 2.0 Tools”.
  • You will now be able to fill in information to create an account.
  1. Once you have created your account click again on the “Data & Tools” tab.  Within this tab you will find a link titled “SeaTube”.  Click on the link.
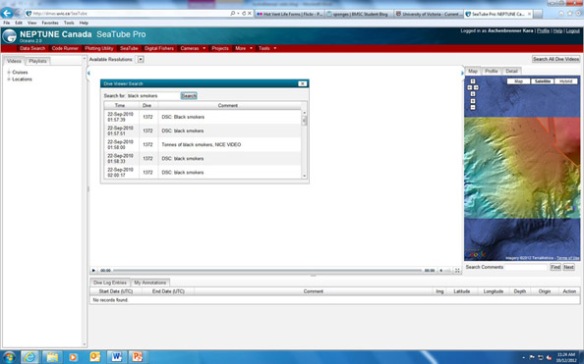
  1. Now that you have accessed NEPTUNE Canada SeaTube Pro, click on the “Search All Dive Videos” link located in the top right corner of the screen.  A “Dive Viewer Search” window will now appear on your screen. You are now able to type in a keyword describing a seafloor feature that you would like to view.  Some recommended keywords to view great video clips for hydrothermal vents are “black smoker”, “white smoker” and “tubeworms”.  However, feel free to explore other sea-floor features!

SeaTube

  1. Once all searches have appeared in the “Dive Viewer Search” window, click on a dive which appeals most to you.  Once you have clicked on this dive, the video clip will automatically begin to play.
  2. In the top right hand corner of the video there are links which enable you to record video clips and add personal video annotations of what you see.  You are then able to save these video clips to your playlist, located in the top left corner next to the “video” tab.

References:

NEPTUNE Canada, 2012.  NEPTUNE Canada: An Invitation to Science. Victoria, BC: University of Victoria.

Tunnicliffe, V., 1992. Hydrothermal-Vent Communities of the Deep-Sea. American Scientist. 80 (4). Pages: 336-349.

Oceanographic Data with R: Plot NEPTUNE Canada Data

by Allan Roberts

This tutorial shows you how to plot data, available from the NEPTUNE Canada website  (www.neptunecanada.com), with the statistical application R. R is free software, and can be downloaded from the R Project site (www.r-project.org/). For this tutorial I will assume that you are familiar with the basics of RFolger Deep bottom pressure

Step 1. Download a CSV file

1.1 Go to the NEPTUNE Canada website:

NEPTUNE headerhttp://www.neptunecanada.com

1.2 Click on “DATA & TOOLS”:

Data & Tools

1.3 Click on “open an account”. You will need an e-mail address, and have to make up a password:Open account

1.4 From the “DATA & TOOLS” page, click on “Data Search”:Data Search

1.5 You need to choose a data source. Click on the “+” sign next to the Folger location:Folger data source

1.6 Click on the “+” sign next to “Folger Deep”:Data source

1.7 Click on the “CTD” for the conductivity-temperature-density sensor:CTD selection

1.8 Click on “Next >>”:Next button

1.9 Set “Date From (UTC)” to September 1, 2012, 00:00:00.Date from

1.10 Set “Date To (UTC)” to September 2, 2012, 00:00:00.Date to

1.11 For “Subsample Type”, choose “Minute”:Subsample type

1.12 Under “Time Series Scalar Data”, click next to “Pressure” in the column for “CSV”:Time series scalar data download

1.13 Click on “+ Add to Cart”:Add to cart

1.14 Click on “Next >>”:Next button

1.15 Click on “Checkout”:Checkout

1.16 Wait …

1.17 Click on “Folger_FolgerDeep_CTD_Pressure_201209.csv” to download it:Download csv

1.18 Create a folder on your desktop called “NEPTUNE data”, and drop the downloaded CSV into the “NEPTUNE data” folder:Create NEPTUNE folder

1.19 For convenience, re-name the file “Folger Deep Pressure.csv”:

Rename file

Step 2. Read the CSV file into R

 2.1 In the R console type “getwd( )”. This will tell you what your current working directory is:getwd working directory

2.2 If you are on a Mac click on “Misc”, and choose “Change Working Directory”:mac wd

If you are on a PC, click on “File”, and choose “Change dir …”:pc wd

2.3 If you are on a Mac, browse for the “NEPTUNE data” folder, click on it, and click on “Open”; if you are on a PC browse for the “NEPTUNE data” folder, click on it, and click on “OK”.mac choose folder

2.4 In the R console, type “getwd( )”; the “NEPTUNE data” folder should now be your working directory:console view of new wd

2.5 Read the CSV file into R, using the “read.csv” function. (The arrow symbol is a combination of the less than sign, ‘<’, and the minus sign, ‘-‘.)read csv

2.6 Type “head(data)” to take a look at the first few lines of data:head(data)

2.7 Type “names(data) <- c(“time”, “pressure”)”.

names(data)

2.8 Type “head(data)” again. Now the columns should have names:head(data) again

2.9 To see all the data, simply type “data” and press “enter.”


Step 3. Plot the Data

 3.1 Now plot the data:plot data

3.2 To plot the data as a line graph, with labeled axes, type:line graph

3.3 Add a title:Add title

Citations

NEPTUNE Canada, 2012. Website. Accessed Sept. 26, 2012: www.neptunecanada.com

R Core Team (2012). R: A language and environment for statistical computing. R Foundation for Statistical Computing, Vienna, Austria.

Data from the Seafloor

by Allan Roberts

If you’ve taken a course at the Bamfield Marine Sciences Centre, you’ve learned to check the weather before heading out into the field. But what about environmental conditions at the bottom of the ocean? You can find oceanographic data online, and download it from the NEPTUNE Canada network (NEPTUNE Canada, 2012).

In Figure 1, I’ve plotted temperature, salinity, and pressure data for September 1, 2012. I downloaded comma separated value (CSV) files from the NEPTUNE Canada website, and plotted these data using the statistics application R (R Core Team, 2012).

These data are from the conductivity-temperature-depth (CTD) sensor for the Folger Deep site (located near Bamfield) at a depth of 94 m.

Folger Deep CTD plot

Figure 1. Temperature, salinity and pressure plots from the NEPTUNE Canada network site at Folger Deep, for Sept. 1, 2012 (Pacific Standard Time), 48.814 N, 125.281 W. Data source: www.neptunecanada.com (accessed Sept. 24, 2012).

CITATIONS

NEPTUNE Canada, 2012. Website. Accessed Sept. 24, 2012: www.neptunecanada.com

R Core Team (2012). R: A language and environment for statistical computing. R Foundation for Statistical Computing, Vienna, Austria.